The Groww platform allows users in India to trade Stocks, Mutual Funds, ETFs — and importantly for active traders — Futures & Options (F&O). (Wikipedia)
One of Groww’s useful features is the Option Chain (also called “Option Matrix” or “Option Table”). This feature lists all available option contracts (both Calls and Puts) for a given underlying asset (stock or index), along with associated data like strike price, last traded price, open interest, bid/ask, volume, etc. (Groww)
In this blog, we’ll unpack how to read and analyse the “Groww Option Chain,” what data it shows, why that data matters — and how traders use it to gauge market sentiment or plan trades.
What Is an Option Chain — Basic Definition
-
An option chain is like a big directory listing every option contract available for an underlying security (stock or index). That includes all strike prices and all expiry dates. (Groww)
-
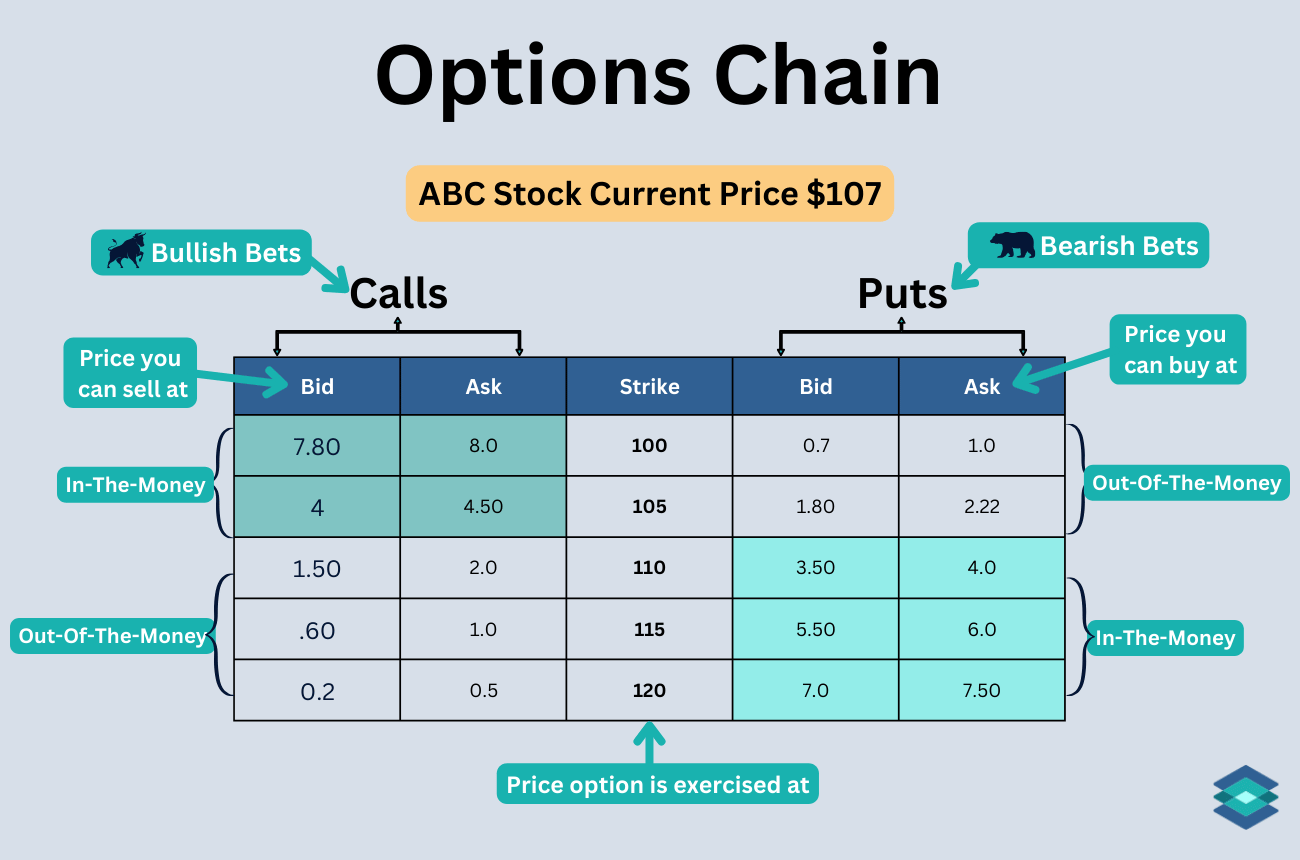
For each combination of strike price + expiry date, there are two possible contracts: a Call option (right to buy) and a Put option (right to sell). The option chain shows both sides. (Groww)
-
In short: Option chain = All Calls + Puts for given security, with detailed data.
Why this is helpful: instead of checking each contract individually, you have a full snapshot of what’s available — useful for comparing, strategising, and spotting opportunities. (Groww)
Components of the Option Chain — What Data You Get
When you open an option chain on Groww (or similar platforms), you typically see a table. Here are the main columns/fields you should understand: (India Infoline)
| Field / Column | Meaning / What It Shows |
|---|---|
| Strike Price | The predefined price at which the underlying stock/index can be bought (Call) or sold (Put) if option is exercised. It’s the central reference column of the chain. (India Infoline) |
| Last Traded Price (LTP) | The most recent price at which that option contract was traded — i.e. its current market premium. (Groww) |
| Bid Price / Ask Price | The best price currently being offered by buyers (bid) and sellers (ask). Indicates liquidity and how easy it is to enter or exit a trade. (Groww) |
| Bid Quantity / Ask Quantity | Number of contracts buyers or sellers are willing to trade at bid/ask prices. Helps gauge depth. (Groww) |
| Volume | How many contracts have been traded today for that strike and expiry — reflects recent interest/activity. (Groww) |
| Open Interest (OI) | Total number of open (outstanding, unsettled) contracts for that strike. Higher OI often indicates more liquidity and indicates where market participants are placing their bets. (India Infoline) |
| Change in OI (ΔOI) | Change in open interest since previous day — rising OI can mean new positions are being created, falling OI can mean positions are being closed. (India Infoline) |
| Implied Volatility (IV) | A derived value reflecting the market’s expectation of future volatility of the underlying asset. High IV = market anticipates big moves. (India Infoline) |
Depending on the platform (or version of option chain UI), you might also see advanced metrics like “Greeks” (delta, theta, vega, etc.), or other columns. (TradingView)
Why Option Chain is Important — What It Tells Traders
Option chain isn’t just a table — it’s a powerful market sentiment and liquidity tool. Here are some of the main uses:
-
Gauge Liquidity & Depth
-
High OI + high volume + tight bid-ask spread = good liquidity → easier to enter/exit positions. (India Infoline)
-
Thin volume or wide bid-ask can mean illiquidity — risky for big trades.
-
-
Spot Where Market Expects Support/Resistance
-
If many puts have high OI at a lower strike → that strike may act as a support zone.
-
If many calls have high OI at a higher strike → that strike may act as resistance. (India Infoline)
-
-
Predict Potential Price Moves / Volatility
-
By checking IV — one can see how much the market expects the price to swing. (TradingView)
-
Changes in OI with price moves can hint whether traders are building bullish or bearish positions (fresh longs/shorts vs. unwinding). (India Infoline)
-
-
Plan Entry/Exit and Option Strategies
-
Market Sentiment & Risk Warnings
-
Sudden spike in OI or volume in deep OTM options — could signal expectation of big moves or volatility ahead (earnings, news, etc.) (India Infoline)
-
In short: option chain gives a snapshot of how traders collectively view the future — in terms of price levels, risk, volatility, and liquidity.
How to View Option Chain on Groww (Step‑by‑Step)
If you are using Groww and want to open an option chain, here is how you go about: (Groww)
-
Login to your Groww account. (Groww)
-
From menu, go to “F&O” — Futures & Options section. (Groww)
-
Search the index or stock you are interested in — e.g. NIFTY 50. (Groww)
-
Click “View Option Chain” for that index or stock. This will show a table with all available strikes and relevant data for both Calls and Puts. (Groww)
-
Analyse the data — check OI, volume, bid-ask, IV — to gauge liquidity and market expectation.
Groww has improved its option chain interface in recent updates: e.g. “Pro Option Chain” version — cleaner UI, better data layout — making it easier for traders to read and act quickly. (Rakshit's Portfolio)
Example: Reading Option Chain with a Hypothetical Strike
Let’s assume NIFTY is currently trading at ₹18,000. In Groww’s option chain table for NIFTY, you see these for strike ₹18,500 (Call) and ₹17,500 (Put):
-
Call @ ₹18,500: LTP = ₹120, Bid = ₹118, Ask = ₹122, OI = 45,000, Volume = 5,000
-
Put @ ₹17,500: LTP = ₹80, Bid = ₹78, Ask = ₹82, OI = 60,000, Volume = 6,500
From this you could infer:
-
There is significant interest (high OI + volume) in both strike sides, so liquidity is good — easier to trade.
-
Higher open interest in Put at lower strike (₹17,500) might suggest many traders are hedging or betting on downside — hint of bearish sentiment / support zone near 17,500.
-
Call at 18,500 shows interest too — maybe traders expecting potential upside / resistance test.
If you see rising OI & rising premium for calls (while underlying is stable), it could mean fresh bullish positions — a signal for potential upward move.
Limitations & What Option Chain Does Not Tell
Option chain is powerful — but not a magic crystal ball. Here are its limitations:
-
It shows contracts available now — but doesn’t guarantee future execution, nor ensures that liquidity will stay the same until you trade.
-
High open interest doesn’t always mean a price move — positions could be hedging, arbitrage, or neutral strategies.
-
Option chain doesn’t show why traders are buying/selling: it doesn’t tell you their intentions (hedge vs speculation).
-
Implied volatility (IV) gives expectation of volatility — but doesn’t predict direction. A high IV means “market expects big move”, but not whether up or down.
-
External factors (earnings, macroeconomic events, global sentiment) can override what option chain suggests.
Hence, option‑chain analysis should be combined with technical or fundamental analysis, and risk management — never used in isolation. (Groww)
Conclusion
Option chain — especially on platforms like Groww — is a very handy tool for traders who want a comprehensive view of all available options, market sentiment, liquidity and volatility for a given stock or index.
By learning to read key metrics like strike price, LTP, bid/ask, volume, Open Interest, Implied Volatility — you can get a snapshot of how market participants are positioning themselves: where they expect the stock/ index to move, where support/resistance might lie, and how much volatility is priced in.
But remember — option chain is a guide, not a guarantee. Use it as part of a broader trading plan, with due caution, proper risk management, and awareness of external factors.