TradingView is a powerful online charting and market-analysis platform widely used by traders and investors across the world.
Whether you trade stocks, forex, crypto, commodities or indices — TradingView brings live (or near-live) and historical data all in one place.
It’s more than just price charts — TradingView offers a suite of technical-analysis tools, chart types, drawing tools, and even a scripting feature (Pine Script) so you can build custom indicators or trading strategies. (TradingView)

Key Features and Tools of TradingView
✅ Multiple Chart Types & Visualizations
-
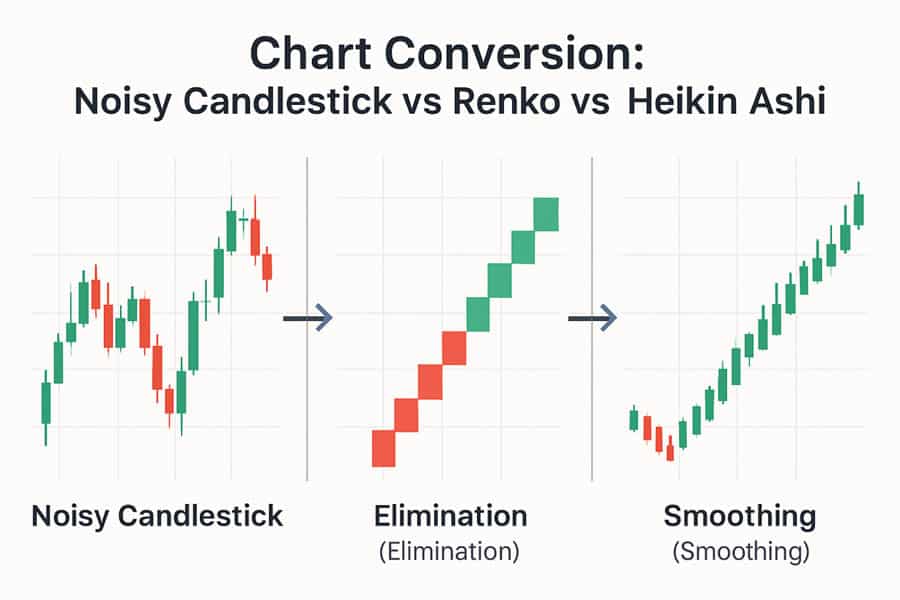
TradingView supports many chart types — candlesticks, bar charts, line charts, and advanced types like Renko, Kagi, and more. (tradingview-chart.org)
-
You can use different chart styles depending on your trading approach — e.g. traditional candlestick for swing trading, Renko for trend-based analysis, etc. (tradingview-chart.org)
🛠️ Technical Analysis & Drawing Tools
-
The platform includes 100+ built-in technical indicators: moving averages, RSI, MACD, Bollinger Bands, volume indicators, and more. (TradingView)
-
Along with indicators, there are powerful drawing/annotation tools — trendlines, Fibonacci retracement, text notes, support/resistance zones — useful for marking key levels and patterns. (chartingpath.com)
🧠 Flexibility: Timeframes, Multi-Chart Layouts & Historical Replay
-
You can zoom in or out, switch timeframes (minutes, hours, daily, weekly, monthly), which helps for intraday, swing or long-term analysis. (chartingpath.com)
-
For advanced users, TradingView supports multi-chart layouts — you can view multiple instruments or multiple timeframes side by side. (TradingView)
-
There is also a “Bar Replay” feature — you can rewind markets and replay historic price action to backtest ideas or review past setups. (TradingView)
📈 Strategy Building & Customization via Pine Script
-
If standard tools aren’t enough, Pine Script lets you build your own indicators or trading strategies, customizing them to your style. (TradingView)
-
This feature opens possibilities for systematic trading, quant strategies, or even creating unique visual tools on charts. (TradingView)
🔔 Alerts, Watchlists & Real-Time/Fundamental Data Integration
-
You can set alerts on price levels, indicator conditions, or even when price interacts with your drawing tools — helps you not miss trade setups. (TradingView)
-
TradingView supports watchlists, so you can track multiple symbols and quickly jump between them. (FP Markets)
-
For broader analysis, there’s access to fundamental data (for many stocks), and in many integrations — charting + trading + data + news in one view. (FP Markets)
🌐 Community + Social / Sharing Features
-
TradingView isn’t only a tool — it’s also a social platform: traders publish chart analyses, share ideas, scripts, and you can learn from community shared analyses. (FP Markets)
-
This makes it good for both beginners (to learn) and experienced traders (to share strategies or get inspiration). (TradingView)
Pros & Cons — What Works Well, What to Keep in Mind
| ✅ Pros | ⚠️ Things to Watch / Possible Cons |
|---|---|
| Rich chart types & technical tools — suits many trading styles (day, swing, long-term) | Free version sometimes gives delayed data — real-time may require subscription for certain exchanges. (tradingview-chart.com) |
| Highly customizable — chart types, indicators, drawings, Pine Script | Overwhelming for beginners — too many options can confuse new traders. |
| View multiple charts/timeframes simultaneously — good for comparison & strategy building | Some advanced features (multi-chart layout, server-side alerts, many indicators) may need paid plan. (tradingview-chart.com) |
| Access to community ideas, shared scripts, social learning environment | Charting + social + broker ads could clutter interface for users who just want simple charts. |
| Ability to integrate with brokers — trade directly from charts (depending on broker) | Not all brokers supported everywhere — in India and some markets, integration may be limited. (FP Markets) |
How to Use TradingView — Step by Step (Basic to Intermediate)
-
Open TradingView and sign up / login — free plan is enough to start exploring charts.
-
Search for the instrument — Equities, Forex, Crypto or any supported asset.
-
Choose chart type & timeframe — e.g. candlestick + daily or 5-minute for intraday.
-
Add indicators or drawing tools — e.g. moving average, RSI, trendlines, support/resistance zones.
-
Save chart layout — so you can revisit same setup.
-
Use watchlist and alerts — track multiple instruments and get notified when conditions match.
-
(Optional) Use Pine Script — if you want custom indicators / automated strategy ideas.
-
(Optional) Explore community ideas and scripts — see what others are analyzing or use their scripts.
For example, if you want to trade Indian stocks or international forex: you can open chart → apply “candlestick + 50-day SMA + RSI” → draw support/resistance → set alert when price crosses support → wait for alert → check volume/confirmation → make decision.
Why TradingView Is Popular Among Traders & Analysts
-
Because it offers a unified environment: real-time + historical data + variety of chart types + technical & fundamental data + drawing/analysis tools + community sharing — all in one place.
-
Its flexibility supports many trading styles: from short-term scalpers to long-term investors.
-
The affordable entry — with free tier and optional paid plans — means beginners can start without big investment.
-
For intermediate/advanced traders, tools like Pine Script, multi-chart view, backtesting capability, and alerts give a professional-grade setup.
-
Community element makes it an ever-evolving ecosystem: people share ideas, scripts, and strategies — helping everyone learn faster.
What to Know (Especially from India / Asia) — Practical Considerations
-
Free version might have delayed data for some exchanges — so if you need real-time quotes (for intraday), check if your exchange/data feed is supported or consider paid plan.
-
If you connect a broker account, verify broker integration for Indian brokers — not all global brokers may work smoothly.
-
Use risk management and research — charts and tools help analysis, but actual market moves depend on many factors (fundamentals, news, global events).
-
For new traders: begin with basic charts + simple indicators + manual analysis before diving into custom scripts or complex overlays — to avoid confusion and analysis paralysis.
Conclusion — TradingView as a Powerful Charting Companion
TradingView offers a comprehensive, flexible, and highly customizable charting platform that works for beginners and advanced traders alike.
Its rich set of chart types, technical tools, drawing and scripting capabilities makes it an ideal choice for anyone wanting to analyze markets, plan trades, or even develop systematic strategies — all from one interface.
If you are serious about trading or investing (in any market — stocks, forex, crypto, commodities), using TradingView wisely can significantly enhance your analysis and decision-making.